scale(1.3637)'%3E%3Cg clip-path='url(%23cb)'%3E%3Crect x='0' y='0' width='1024' height='1024' fill='url(%23pg)'%3E%3C/rect%3E%3Cg clip-path='url(%23cf)'%3E%3Crect x='0' y='0' width='1024' height='1024' fill='url(%23fg)'%3E%3C/rect%3E%3C/g%3E%3C/g%3E%3C/g%3E%3C/svg%3E)
Booktabs tables in the Tables workspaceBooktabs tables
Data entry stays separate from layout, with multi-level headers, merged cells and table notes set to academic conventions.Data entry apart from layout, academic conventions built in.

The Tables workspace keeps data entry and layout apart. Changing the data does not disturb the layout, and changing the style does not touch the data.
When it helps
The results are in and need to become a booktabs table for submission. Rules get adjusted cell by cell in a word processor, the decimal points refuse to line up, and when a reviewer asks for one more column the whole table is laid out again.
- Experimental data headed for a booktabs table
- Decimal places and alignment that must be consistent
- Data that will change without the layout being redone
In this guide
Data entry
Click Edit in the View group on the Home tab and change cells directly. Table Size sets the rows and columns.
Multi-level headers
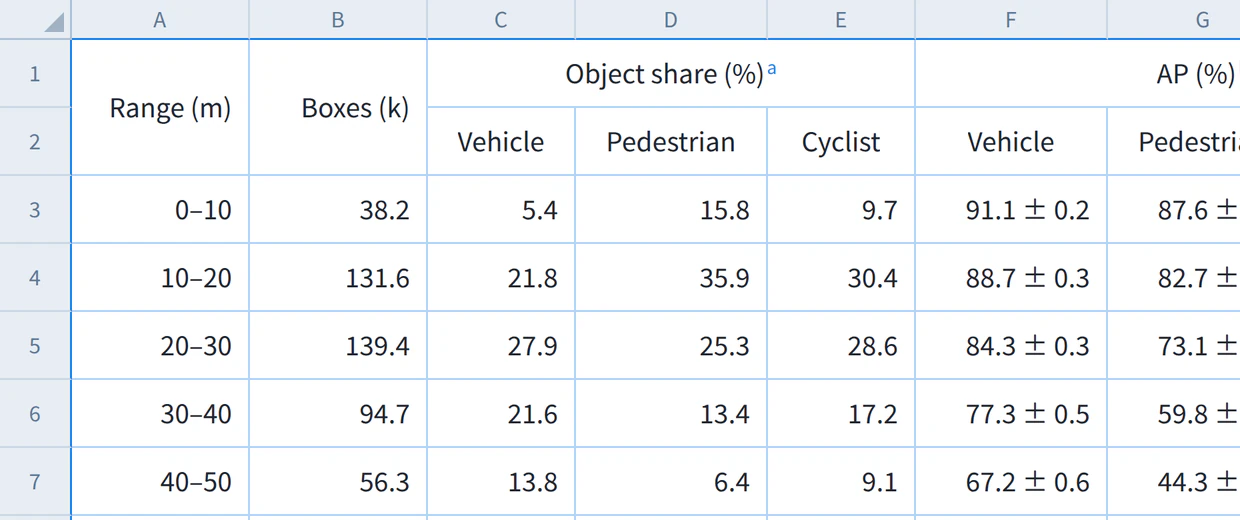
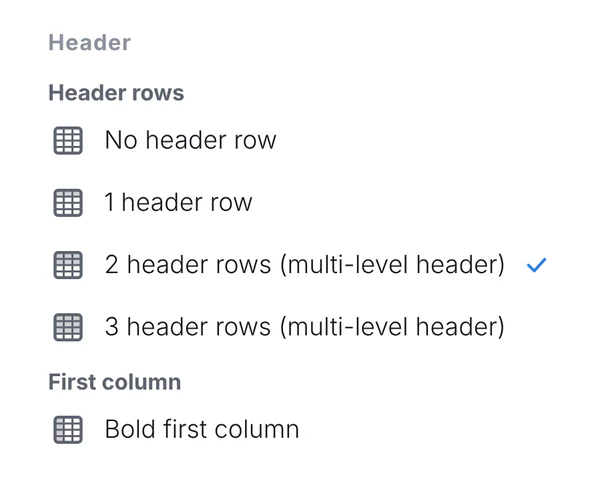
Header in the Cell group sets one, two or three header rows. Drag across cells and click Merge Cells for a spanning header.
Number format and best values
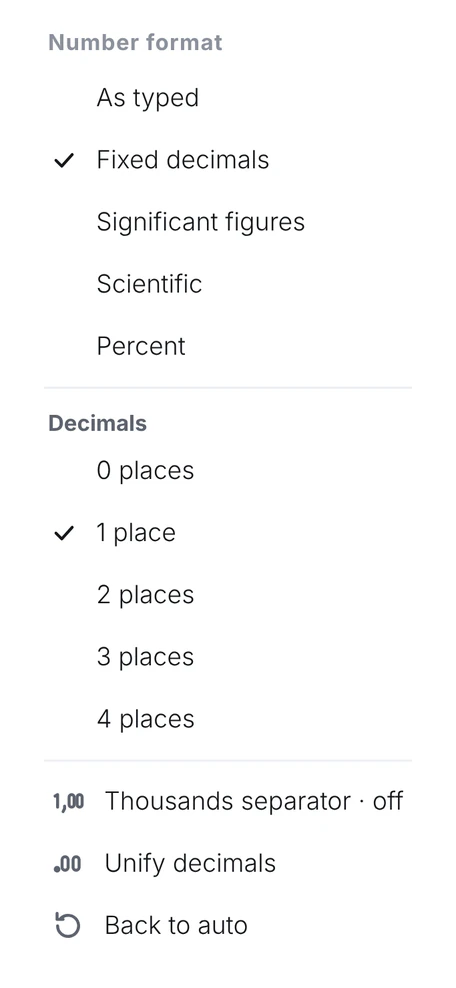
Number Format sets fixed decimals, significant figures, scientific or percent for a column. Best Value bolds the largest or smallest value.
Captions
Click Caption and write the title. The label can be Table 1, TABLE I, a Chinese label or none, and the caption can sit above, below or be hidden.
Table styles
The Style tab has a gallery of styles such as booktabs, wide spacing and double rule. The data stays the same. Save style keeps your adjustments.

Charts from tables
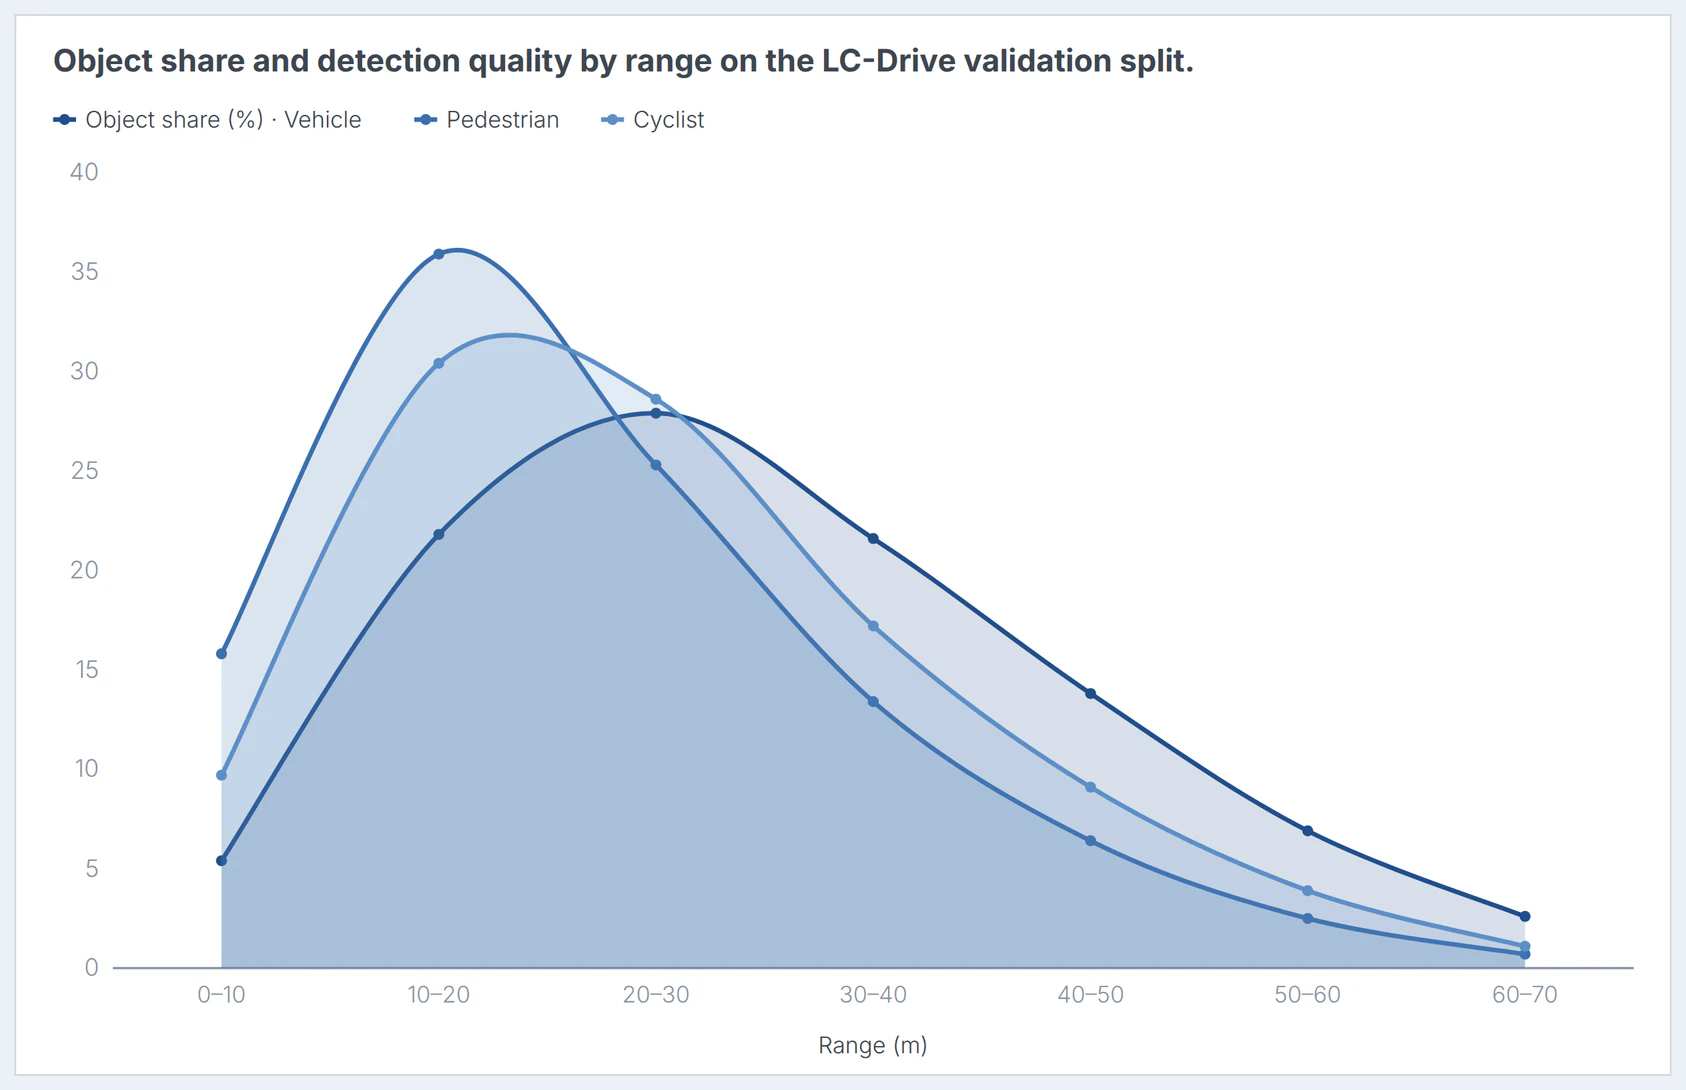
On the View tab, switch from Table to Chart. The same data becomes a bar, line, area or scatter chart. Colors has a color-blind safe palette.
Export and copying
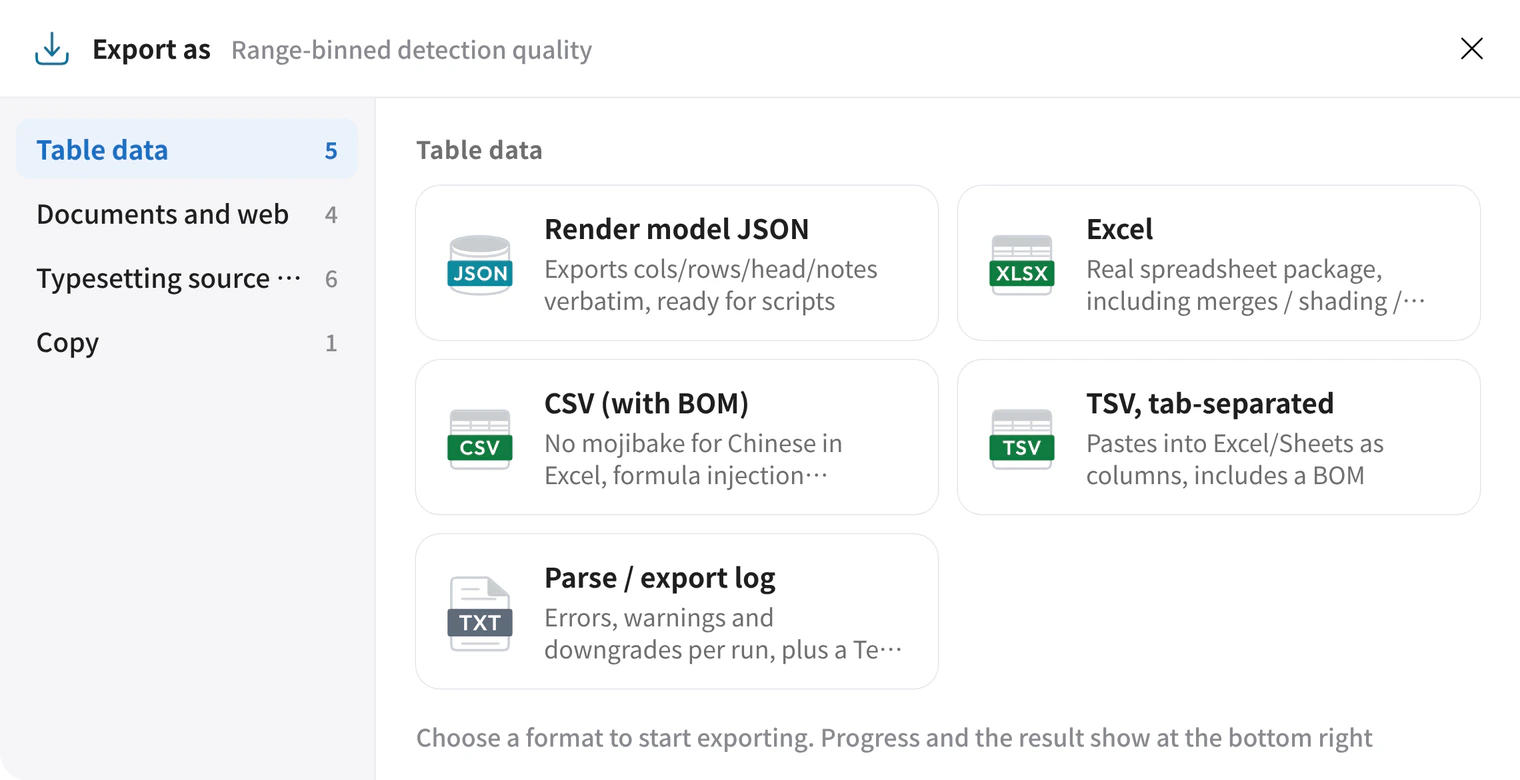
Table data offers Excel and CSV. Typesetting source and images offers LaTeX, Typst and SVG. Under Copy, Copy table copies it as rich text.
What you get
Data and layout are kept apart, so changing the numbers or the style does not mean laying the table out again.